
Introduction
Welcome back to our blog series covering the fundamentals of biosignals processing. Over the last blog posts, we learned about the importance of biosignals processing in modern medicine and other fields, learned what noise factors can be found and how we can remove them with a small yet powerful collection of filters.
But we’re not done yet!
Imagine biosignals like treasure chests full of information. So far, we've learned how to clean the outside of the chests (that's the noise and pre-processing part), and now it's time to open them up and see what's inside. Feature extraction is like finding the special gems and gold coins hidden in these chests – it helps us pick out the most important parts of the data.
In this blog post, we're diving into the exciting world of Feature Extraction and we’ll be unlocking these hidden treasures in biosignals using an Electrocardiography (ECG) signal and Heart Rate Variability (HRV) analysis as an example. As usual, Python notebooks await you for hand-on experience!
Decoding Feature Extraction: Making Sense of the Complex
Imagine you're looking at a biosignal, for example an Electrocardiogram (ECG) recording. It's not just a line with ups and downs; it's a reflection of the heart's activity, including its rhythm and health. But this line is also tangled with noise, spikes, and variations that can make analysis challenging. Feature extraction steps in as a translator. It breaks down the signal into smaller, meaningful pieces – features – that carry vital information. These features could be the distance between heartbeats, the amplitude of certain waves, or the frequency of certain patterns. In simpler terms, feature extraction helps us zoom in on the parts of the signal that matter most.
Now, why is this transformation so crucial? Imagine trying to read a book written in a language you don't understand. It's overwhelming and confusing. But if someone gives you a summary of the book's key points, suddenly it becomes much more manageable. Similarly, biosignals are like books written in the language of our bodies, and feature extraction gives us summaries – key insights – that help us understand what's happening.
But it's not just about simplification; it's about empowerment. By extracting these meaningful components, we can analyze biosignals more efficiently and draw valuable conclusions. Whether it's detecting irregular heartbeats, assessing muscle activity, or understanding brainwave patterns, feature extraction equips us with the tools to grasp the essence of the data.
What types of features should I know?
Let's dive into the diverse world of features that can be extracted from biosignals. These features act like puzzle pieces, each carrying its own unique information, contributing to the complete picture of the signal's story.
The following segments will dive deeper into feature extractions using the example of ECG signal analysis, more specifically using Heart Rate Variability (HRV). HRV analysis extracts parameters from a heart rate series by measuring the intervals between heart rates and providing information about the variation in interval durations.
If you’d like to follow-up the hands-on experience with your own heart rate series yourself, we recommend starting with our Notebook on how to identify R-Peak locations - the heart beat indicators of your ECG signal - from which the heart rate can then be extracted.
Hands on experience with biosignals Notebooks!
Learn how to identify R-Peaks in ECG signals and how to compute heart rate series. → Open Notebook
Temporal Features: Capturing Timing and Durations
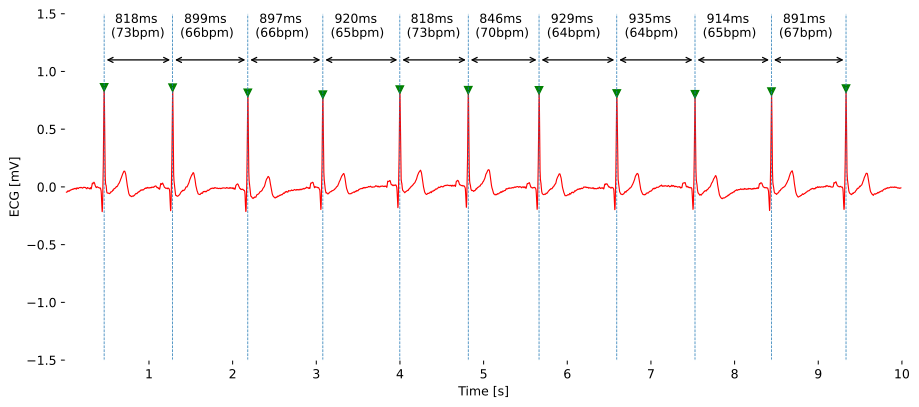
Temporal features focus on the timing aspects of a biosignal. They help us understand how events unfold over time. For instance, in an electrocardiogram (ECG), the R-R interval – the time between consecutive heartbeats – or the N-N interval (NNI) - the time between consecutive normal heartbeats (abnormal or misidentified heartbeats excluded) - is a crucial temporal feature.
This interval tells us about the heart's rhythm and variability. Think of it as the heartbeat's tempo and its ability to adjust its tempo based on the workload. The higher the workload, the higher the heartbeat’s tempo to keep up with a sufficiently high blood circulation and oxygen supply. Healthy hearts show a greater adaptability, and therefore variability, to adjust to it’s tempo to the current needs.
Hands on experience with biosignals Notebooks!
Heart beat intervals are represented in Tachograms that facilitate the visualization of the data converted from the raw ECG signal to a more easier to understand format. In this Python notebook, you’ll learn how to generate a Tachogram using your own heart rate series! → Open Notebook
Statistical Features: Quantifying Variability
Statistical features introduce us to the world of numbers that summarize the signal's behavior. Mean, median, standard deviation – these familiar terms step onto the biosignal stage. In Heart Rate Variability (HRV) analysis, statistical features quantify the ups and downs between normal heartbeats with typical parameters often found being:
- Standard Deviation of Normal-to-Normal Intervals (SDNN)
- Root Mean Square of Successive Differences (RMSSD) of Normal-to-Normal Intervals
- Standard Deviation of Successive differences (SDSD) among many others
This variability can reveal stress levels, autonomic nervous system balance, and more.
Hands on experience with biosignals Notebooks!
Learn about the most important HRV parameters in this Introduction to HRV notebook! → Open Notebook
Spectral Features: Unveiling Frequency Patterns
Spectral features delve into the frequency constituents of a signal. Much like how music comprises various notes, biosignals exhibit distinct frequencies that carry valuable information. Taking Heart Rate Variability (HRV) as an example, the strength of different frequencies – ranging from high to low and those in between – offers profound insights. It essentially highlights dominant frequencies of the provided heart rate series from which we can derive important understanding of the body’s nervous system and other bodily functions that impact the heart rate, including the possible representation of the respiration rate in the heart rate data.
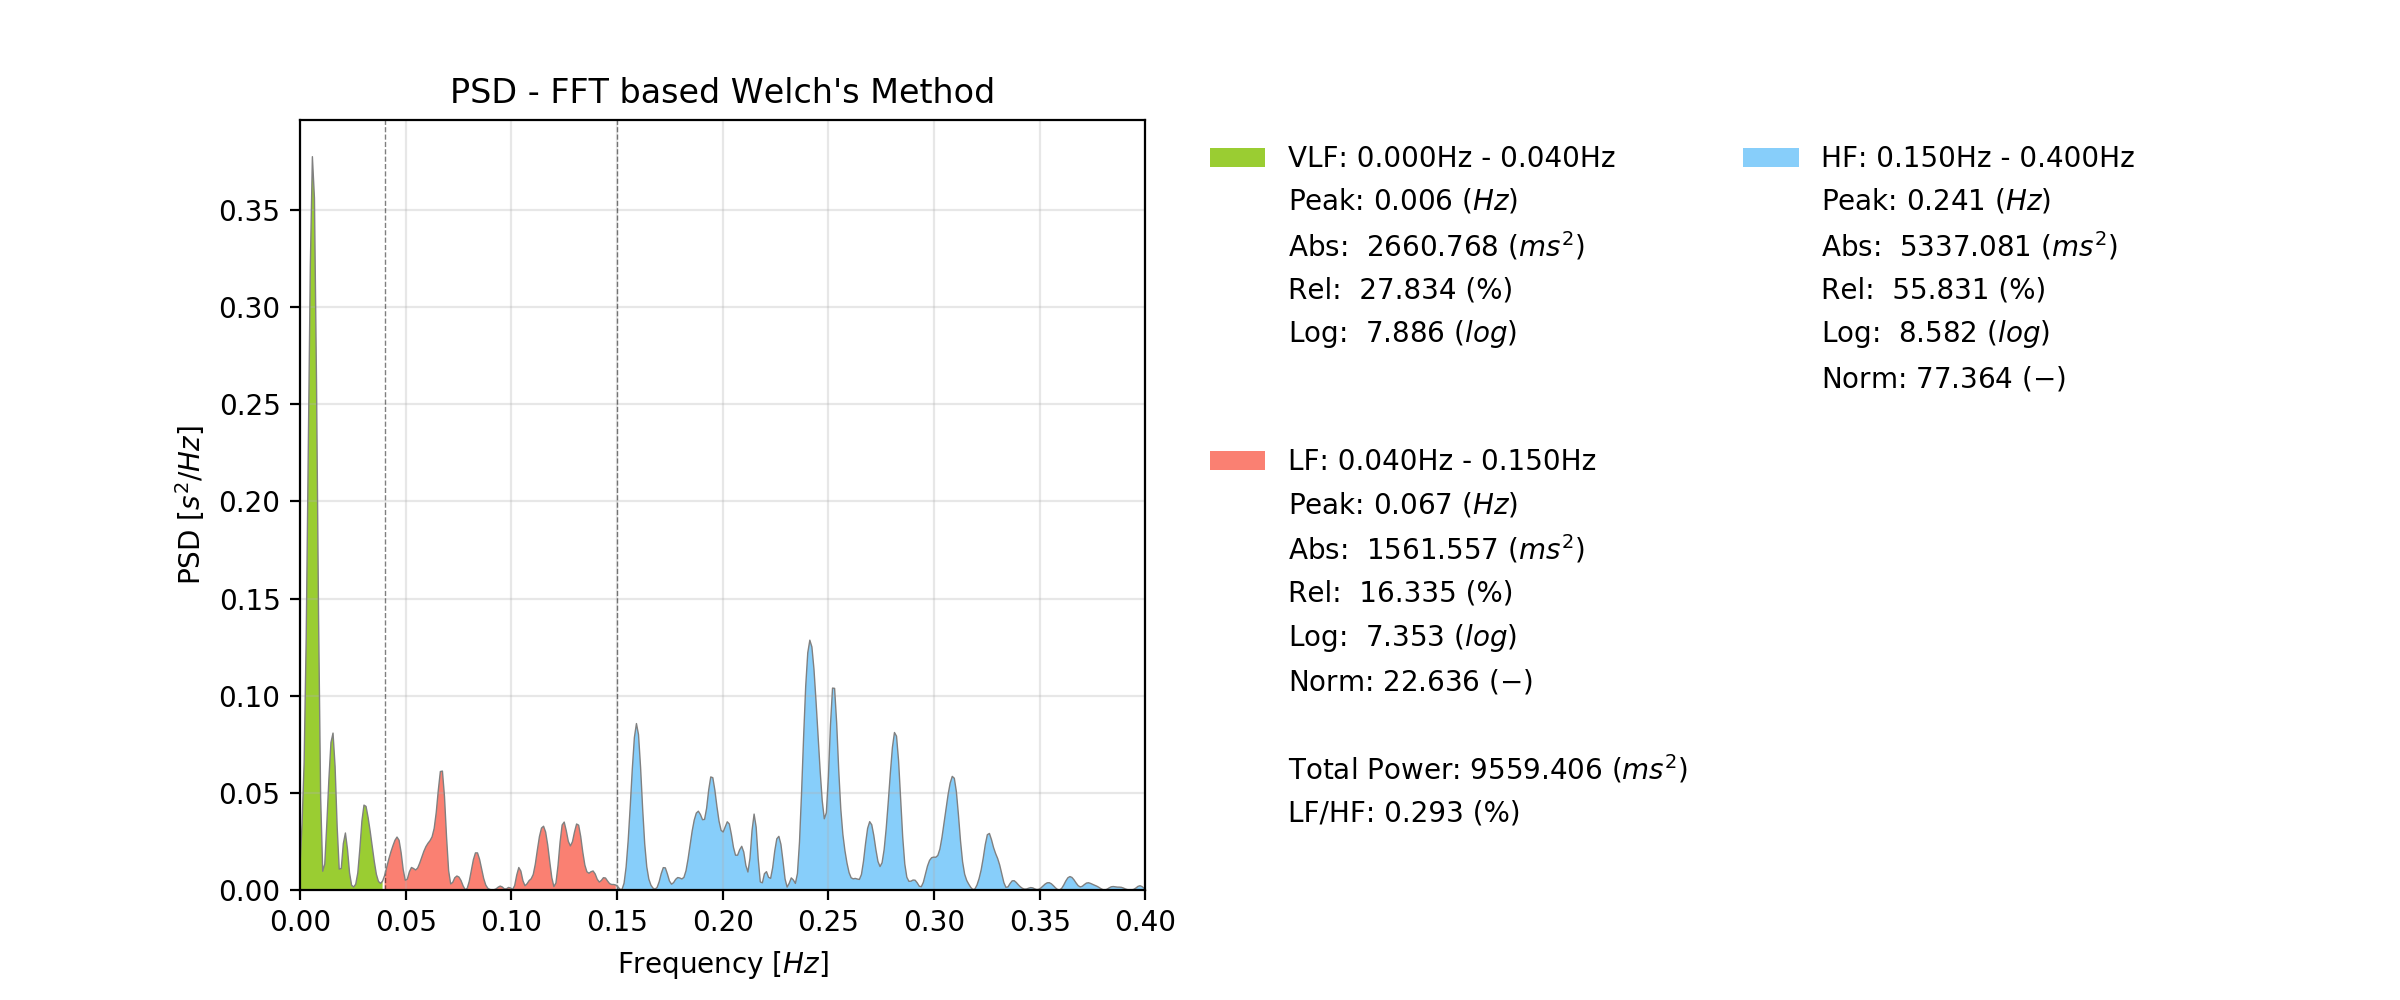
Image source: pyHRV (by the same author of this blog post)
Common tools and methods used for spectral analysis of HRV include the Fast Fourier Transform (FFT) and in HRV specifically a variation of the FFT known as Welch method. The FFT transforms the time-domain HRV signal into the frequency domain, showcasing the power or energy associated with different frequency bands (the higher the power of a frequency, the more dominant it is represented in the input data). The most applied frequency bands in HRV are Very Low Frequency (VLF), Low Frequency (LF), and High Frequency (HF) ranges, which offer insights into various physiological mechanisms, including sympathetic and parasympathetic nervous system activity and even respiration. Statistical parameters are then extracted from each frequency band for further analysis, including the identification of the peak frequency in the band, the band’s absolute power, it’s relative power over the entire FFT of interest, among others.
Spectral analysis is not exclusive to HRV and is commonly found in analysis of other biosignals as well, such as EEG analysis where the signal is analyzed over different frequencies bands to draw conclusions of the state of the monitored brain region (example: focus vs. sleep).
Hands on experience with biosignals Notebooks!
This Python notebook shows you how to compute temporal and statistical parameters from you ECG and heart rate data. → Open Notebook
Morphological Features: Examining Shape and Structure
Morphological features delve into the distinctive shapes and structures of the signal's constituents. Consider this as akin to scrutinizing the contours of mountain summits and troughs. Electrocardiograms (ECG), with their characteristic and recognizable waveforms, serve as an excellent example for illustrating morphological information. The ECG's waveform exhibits distinct components like P-waves, QRS complexes, and T-waves, which correspond to specific electrical events in the heart's cardiac cycle
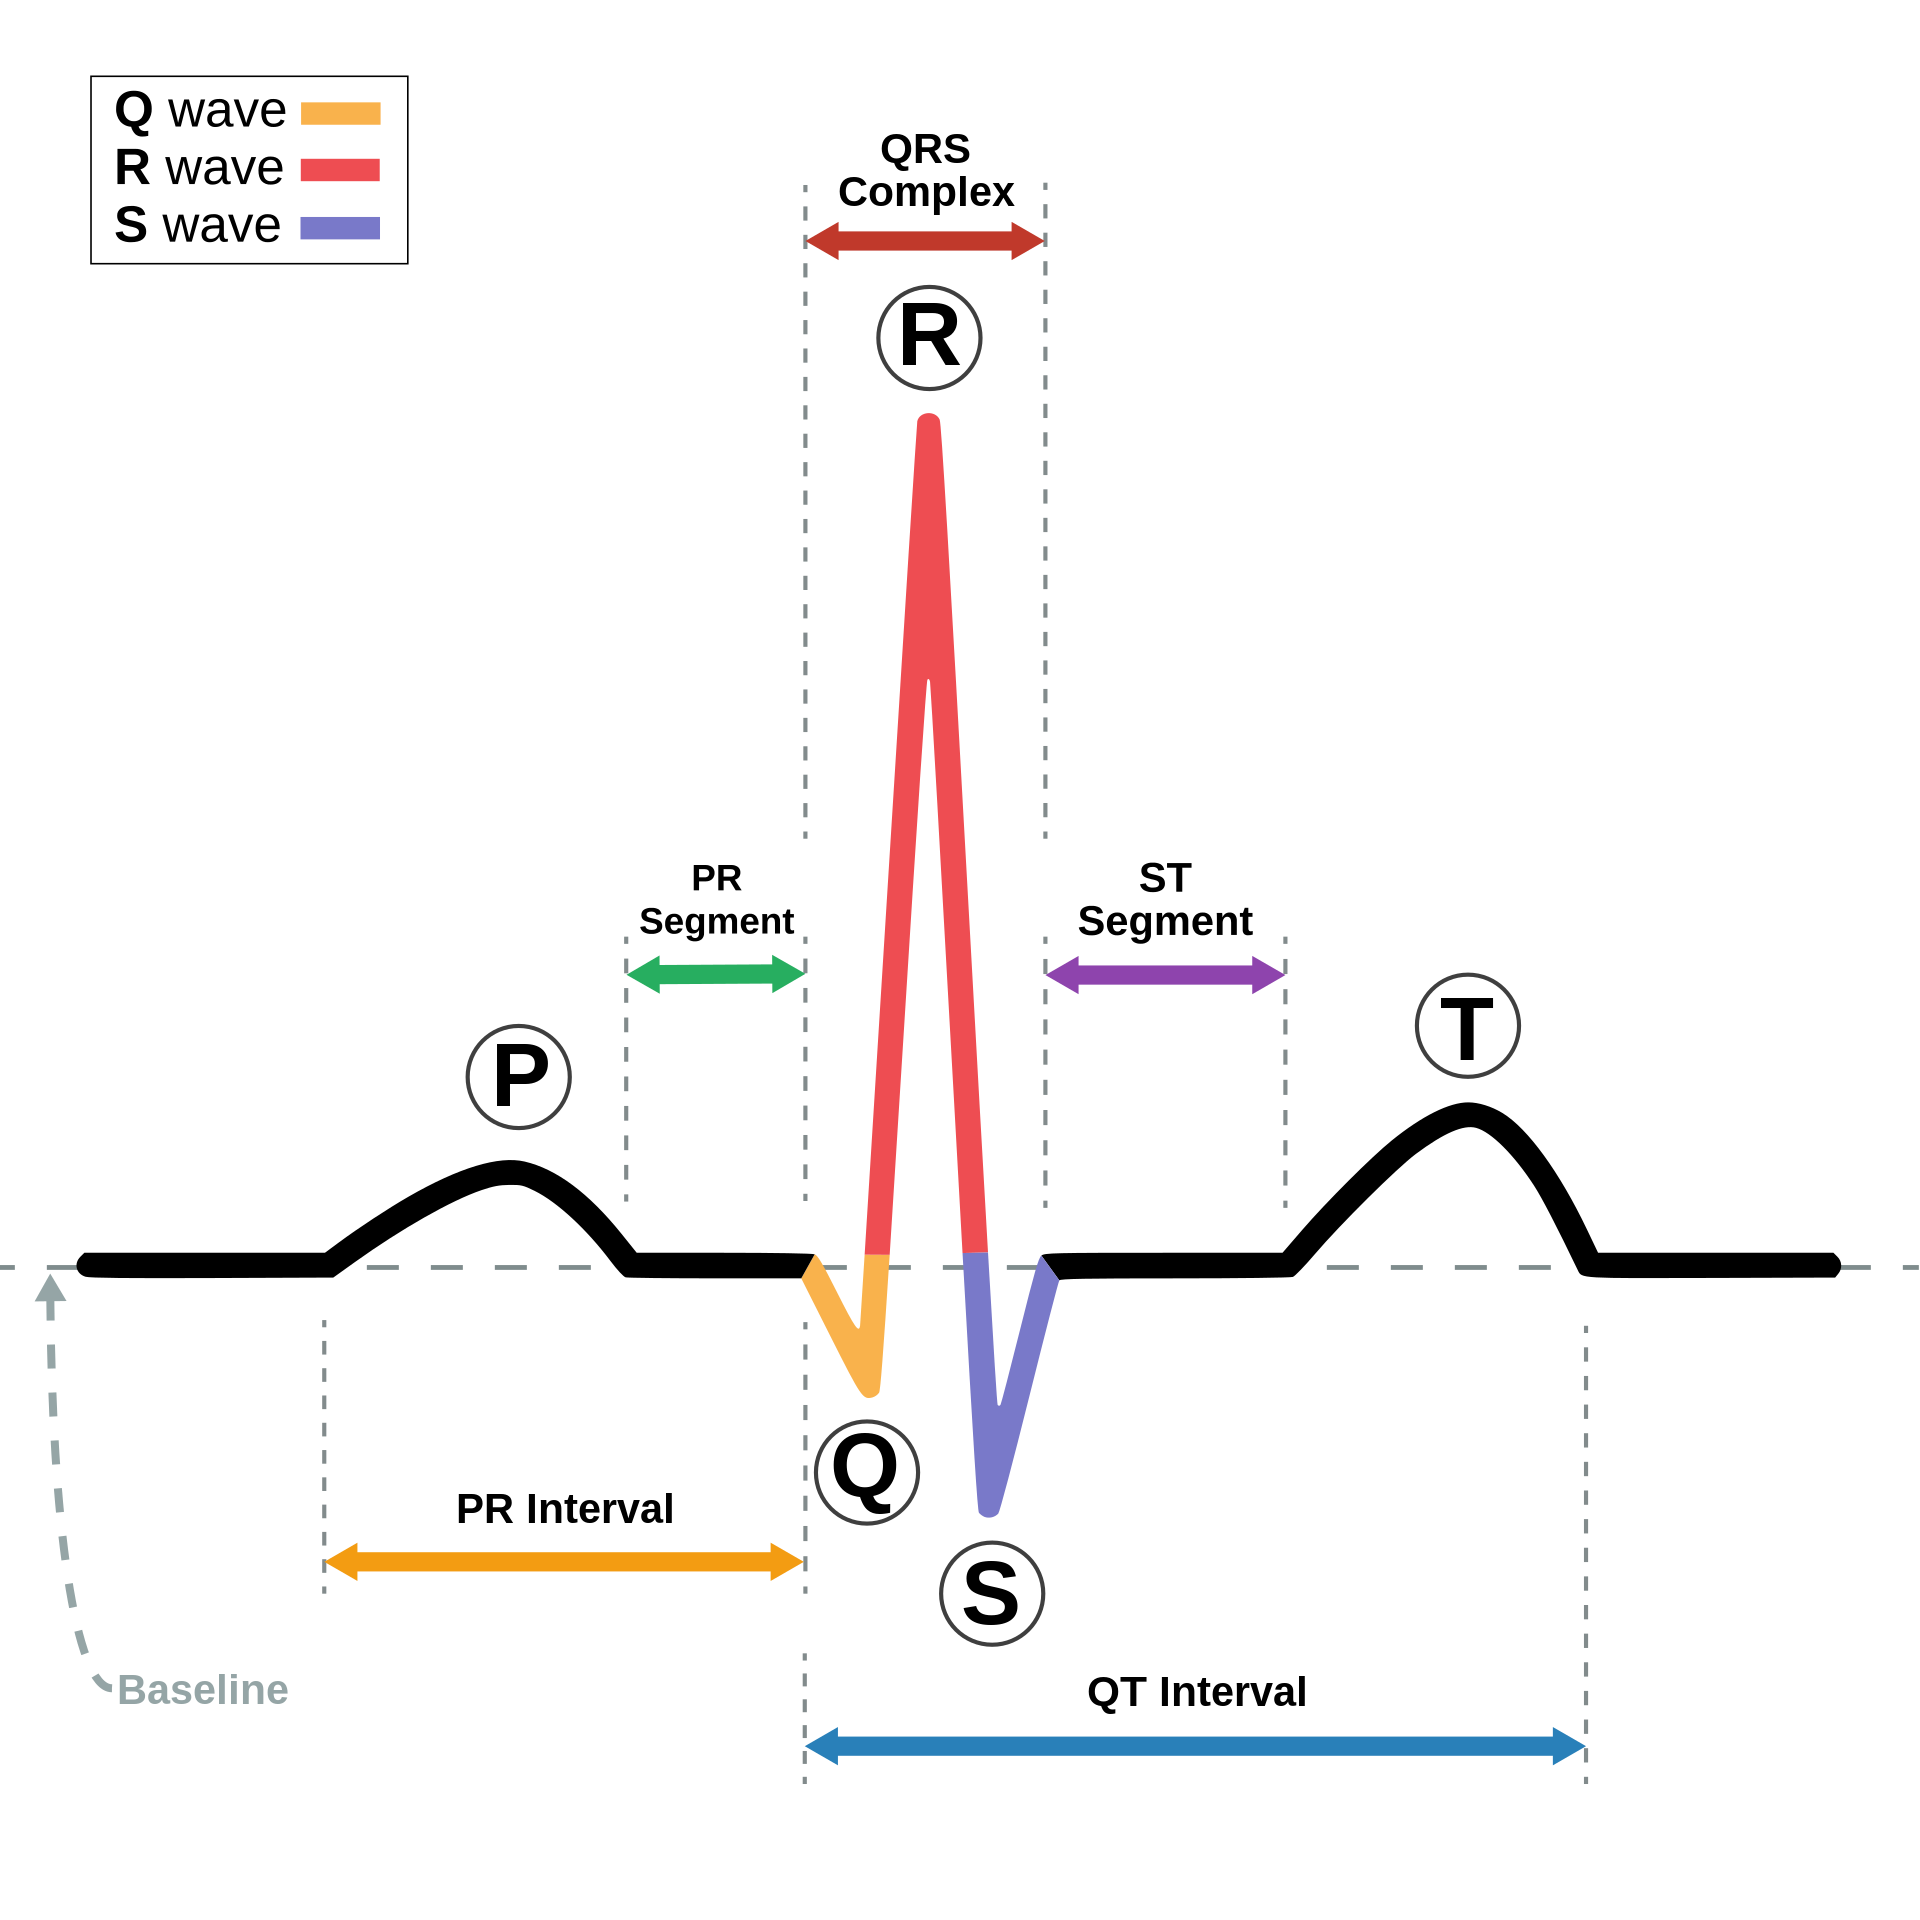
Examples of ECG characteristics and features (image source: wikipedia).
This pronounced waveform in the ECG allows us to effectively leverage morphological features to analyze its detailed structure. By examining the heights, widths, and intervals of these waveform components, we can gain valuable insights into the heart's health, identifying conditions such as arrhythmias, and more. The ECG's clear and identifiable morphology makes it a powerful tool for diagnosing and monitoring cardiac conditions, showcasing the significance of morphological analysis in the realm of medical diagnostics.
And Beyond: Exploring Other Features
Beyond these categories, biosignals offer a treasure trove of other features waiting to be discovered. Complexity, entropy, asymmetry – these descriptors add depth to our understanding. These features are like the hidden details in a painting, enhancing our appreciation of the artist's intention. So, as we journey through feature extraction, remember that each type of feature is a key that unlocks a different facet of the biosignal's story. With these keys in hand, we're equipped to decipher complex data and gain profound insights into human physiology, sports performance, medical diagnostics, and beyond. In the upcoming section, we'll roll up our sleeves and explore the techniques that enable us to extract these valuable features from biosignals.
Coming Up: Real-world examples of biosignals processing with PLUX users
At the beginning of this post, we described biosignals as a treasure just that saveguards valuable gems. Just as we've meticulously cleaned the external layers of this chest to reveal their true brilliance (addressing noise and pre-processing), we've now delved deeper to reach it hidden content. Feature extraction helps us extract these gems from biosignals and provide valuable information that makes us quantify and qualify biosignals in a much easier to understand way. Yet, what we do with the extracted information is not often already part of clinical daily practice and instead a topic that drives continuous research.
Soon, we’ll have a look at what PLUX users are doing in their biosignals processing research to learn more about real-world examples.